The Power of Data Visualization: Unveiling Insights with Visual Tools
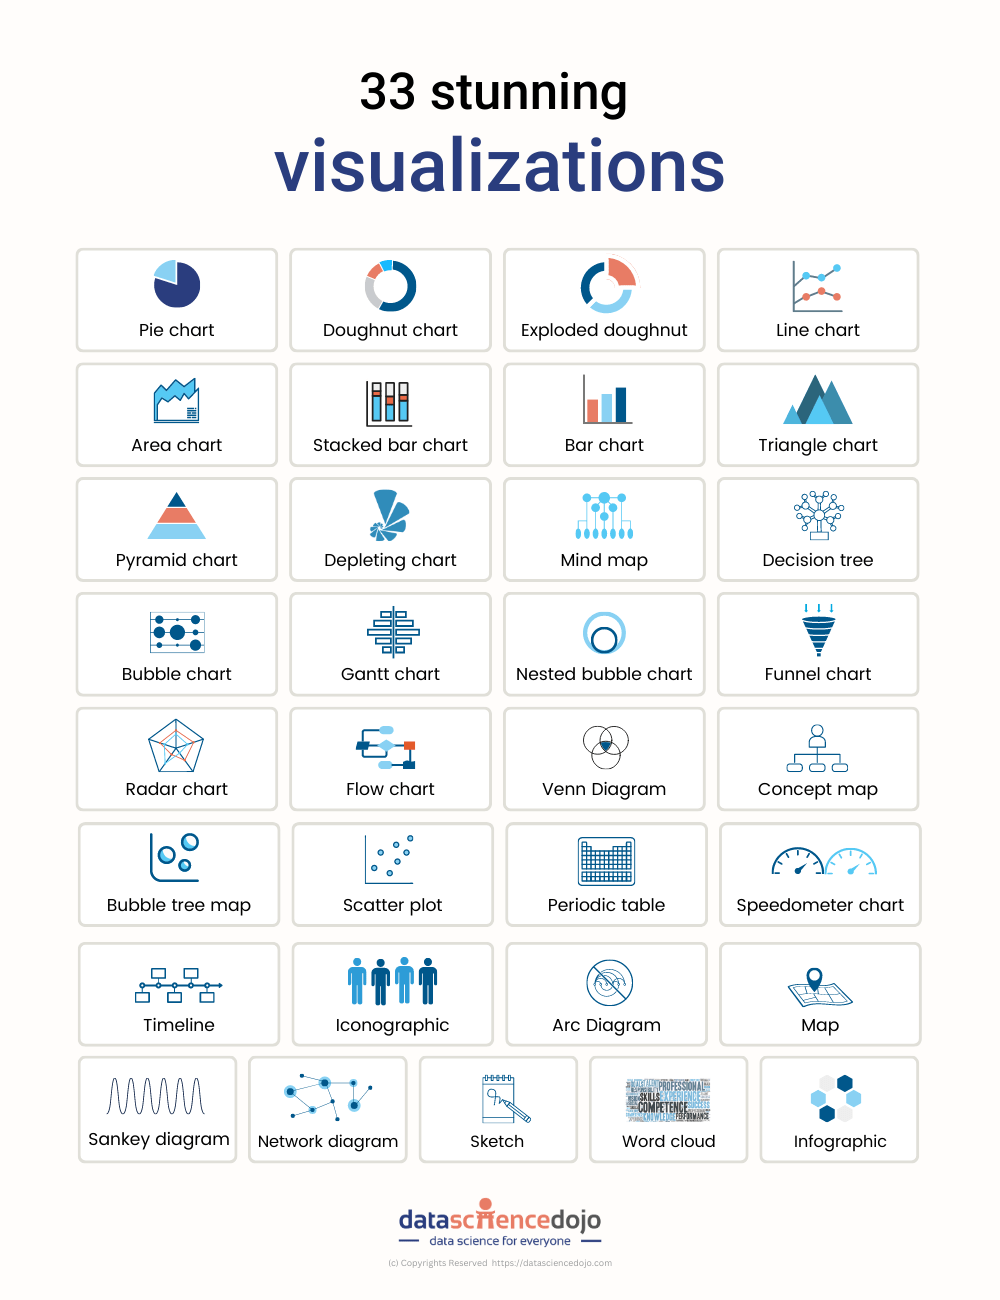
The power of data visualization lies in its ability to transform complex datasets into easily digestible insights. By leveraging visual tools like charts, graphs, and infographics, businesses can communicate their findings more effectively. For instance, a bar chart can quickly illustrate comparisons, while a pie chart can highlight proportions in a dataset. When data is presented visually, it not only enhances understanding but also facilitates better decision-making processes. Here are some key benefits of utilizing data visualization:
- Enhances comprehension of large datasets
- Identifies trends and patterns
- Increases engagement with stakeholders
Moreover, visual tools enable teams to uncover hidden insights that may go unnoticed in raw numbers. A well-designed dashboard can provide real-time updates, allowing businesses to track performance metrics at a glance. The integration of interactive visualizations encourages users to explore data dynamically, leading to deeper analyses and informed strategies. By harnessing the power of data visualization, organizations position themselves to not just portray data but also to tell compelling stories that drive action and innovation.
5 Ways Data Visualization Software Enhances Decision-Making
In today's data-driven world, the effective use of data visualization software is crucial for enhancing decision-making processes across various industries. One of the primary benefits of utilizing such software is its ability to transform complex data sets into easily comprehensible visuals. By employing charts, graphs, and interactive dashboards, stakeholders can quickly grasp trends and patterns that might otherwise go unnoticed. This clear representation of data not only facilitates better understanding but also enables faster decision-making, as actionable insights can be derived at a glance.
Additionally, data visualization tools foster collaboration among team members by providing a shared platform for analysis. When teams can visualize the same data, they can engage in more meaningful discussions, align their goals, and collaborate on strategies. This collective approach not only enhances the quality of decisions being made but also builds a sense of ownership and accountability among team members. In summary, investing in data visualization software is an effective strategy that leads to improved decision-making capabilities, better teamwork, and ultimately, enhanced business outcomes.
How Does Data Visualization Impact Communication and Understanding?
Data visualization plays a crucial role in enhancing communication by transforming complex data into visually accessible formats. By using charts, graphs, and other visual tools, it allows individuals to quickly grasp significant trends and patterns that might otherwise be obscured in raw data. This transformation is particularly important in a world where vast amounts of information can overwhelm traditional methods of data analysis. As a result, audiences can engage with the content more meaningfully and derive actionable insights faster, promoting informed decision-making.
Moreover, data visualization fosters improved understanding across various demographics by catering to different learning styles. For instance, visual learners often benefit from images and diagrams that succinctly convey information. In business settings, effective use of visualization can lead to better presentations, where stakeholders easily comprehend key indicators and metrics. This not only boosts clarity during discussions but also enhances collaboration among team members, as shared visual resources encourage dialogue and promote a united understanding of objectives.